The Female Reproductive System, continued.
Study the graph below which shows the number of pregnancies recorded of girls under sixteen in a province in South Africa from 2001 to 2006.

Between which two years did the greatest increase in the number of pregnancies occur? (1)
What was the percentage increase in this period? (1)
Draw a table to show the data from which this graph was drawn. (6)
Study the graph below and answer the questions that follow.
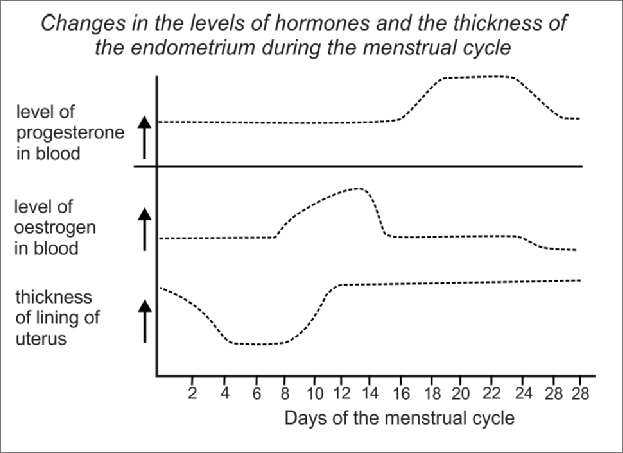
What is menstruation? (2)
Menstruation refers to the discharge of blood and mucus via the vagina when the endometrium breaks down.
On which days shown does menstruation occur: Days 0 - 5 OR Days 5 - 12 OR Days 9 - 16 OR Days 24 - 28. (1)
Using the graph above, describe the changes in the hormone levels that took place before the breakdown of the endometrium. (2)
According to the graphs, the progesterone and oestrogen levels dropped before the uterine lining broke down.
What happens to the endometrium when the level of oestrogen increases? (2)
The uterine lining thickened when oestrogen levels increased.
Explain the importance of high progesterone levels during pregnancy. (2)
Progesterone maintains a thick uterine wall throughout the gestation period. It also inhibits the release of LH and FSH, so no further egg cells develop.
A group of Grade 12 learners visited a hospital in a city to investigate the relationship between birth weight and mortality rate in new born babies. Their results are shown in the graph below. Study the graph and answer the questions that follow.

What is the optimal birth weight for new born babies? (2)
State a hypothesis for this investigation. (2)
The lower the birth weight the higher the mortality rate. OR The higher the birth weight the lower the mortality rate.
OR
There is no relationship between birth weight and mortality rate.
Use the data shown the graph above to draw a table that shows the results they have obtained. (6)
State ONE way in which the learners could improve the reliability of their results. (1)
Visit more hospitals/clinics.
OR
Collect data for several years and calculate averages.
Explain the possible relationship between the birth weight and the new-born mortality rate. (4)
The higher the birth weight the lower the mortality rate up to 3.5 kg then, the higher the birth weight the higher the mortality rate.

Questions source: DBE (Authorisation 11798)
Copyright Exam Fever. All rights reserved.
- Greg Gopaul -